ダッシュボードとウィジェット
ダッシュボード
デフォルトダッシュボード、ビジネスビュー、可用性、アプリケーションの4つのダッシュボードがございます。
ビジネスダッシュボード
顧客獲得数や収益などのビジネス指標を設定し、それに従ってシステムやアプリケーションを監視できます。経営判断にあたり、IT投資をビジネスでのニーズに合わせるのに適しています。
アプリケーションダッシュボード
アプリケーションダッシュボードで、アプリケーションのパフォーマンスとユーザーエクスペリエンスを包括的に把握できます。APMインサイトとリアルユーザー監視(RUM)のデータを組み合わせることで、バックエンドとユーザーレベルのパフォーマンスを統合的に把握できます。必要な監視を選択するだけで、主要なパフォーマンスデータを1つの洗練されたインターフェースで可視化できます。
- アプリケーションダッシュボードは、Applications Managerビルド173200以降でのみサポートされます。
- 現在、セントラルサーバーのインストールではサポートされていません。
監視グループテンプレートダッシュボード
ダッシュボードを設定したら、その設定を監視グループテンプレートとして保存できます。この監視グループテンプレートは他の監視グループに適用できるため、監視グループのダッシュボードの作成が容易になります。
カスタムダッシュボード
カスタムダッシュボード機能を使用すると、環境に合わせたダッシュボードを作成できます。
例えば、Applications
Managerに監視登録されているデータベースのステータスのみ、一覧表示することや、TomcatサーバーにデプロイされたWebアプリケーションのステータスだけを表示するなどのカスタマイズが可能です。
「ウィジェット」を追加することによって、ダッシュボードに様々な機能を追加できます。
カスタムダッシュボードは、既存のダッシュボードとは別に追加されます。
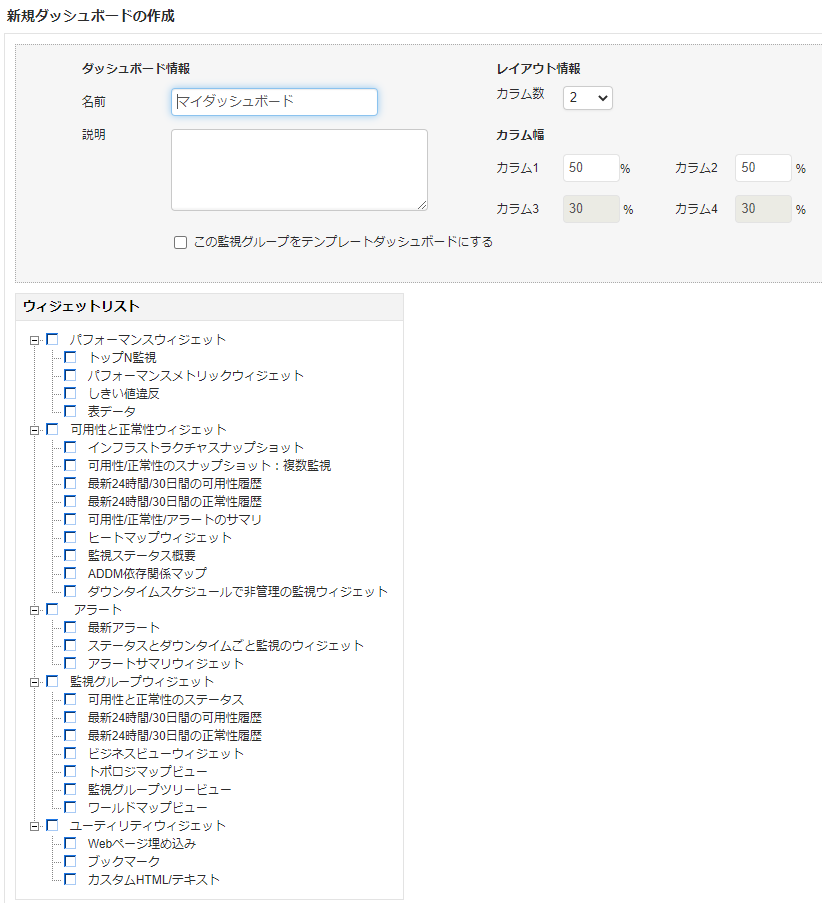
新規ダッシュボードの作成方法
- [ホーム]タブで[アクション]→ 新規ダッシュボードをクリックし、新規ダッシュボードの作成ページに遷移
- ダッシュボードの名前と説明を入力
- ドロップダウンから期間を選択します(例:過去30分間、過去1時間など)
- 任意で、[この監視グループをテンプレートダッシュボードにする]を選択
テンプレート化することで、特定の監視グループに適用したり、すべての監視グループに適用することも可能です。 - ウィジェット一覧から追加するウィジェットを選択
![新規ダッシュボードの作成方法]()
- 「ユーザーの関連付け」機能を使用すると、ダッシュボードを特定のユーザーに関連付けたり、制限したりできます。
「すべてのユーザーとロール」を選択すると、すべてのロールのすべてのユーザーにダッシュボードが割り当てられます。
「すべて」を選択すると、特定のロールの将来のすべてのユーザーにダッシュボードを関連付けることができます。 -
[作成]をクリック
選択したウィジェットを含む新しいダッシュボードが作成されます。 - ダッシュボードにウィジェットを追加すると、編集オプション付きの空のウィジェットが追加されます。ウィジェット編集アイコンをクリックし、ウィジェットに必要なデータが表示されるまでウィジェットのフィルター条件を変更します。
ウィジェット
Applications Managerで用意されているウィジェットは以下の通りです。
- ビルド170300以降、[ウィジェットの公開]ボタンをクリックし、ポップアップに表示されるコードスニペットを利用して、選択したウィジェットをWebポータルに統合することができます。
- SSOが有効な間はウィジェットの公開はサポートされません。
パフォーマンスウィジェット
| ウィジェット名 | 説明 |
|---|---|
| トップN監視 | 選択したパフォーマンスメトリックで上位の値を示す監視を表示 データを表示するには、パフォーマンスメトリックと表示する監視を選択してください。選択した期間のデータのグラフ表示も可能です。 |
| パフォーマンスメトリックウィジェット | 特定の監視のパフォーマンスメトリックの値を表示 選択した期間のデータのグラフ表示も可能です。 |
| しきい値違反 | パフォーマンスメトリックでしきい値超過のあった監視をすべてを表示 選択したパフォーマンスメトリックのグラフ表示も可能です。 |
| 表データ | 監視データを表形式で表示 1ウィジェットで多くのデータを確認可能です。 |
| トポロジマップビュー | リソースの相互接続をマップ上に表示 異なる場所に分散しているデバイスやサーバーの全体把握に活用できます。 トポロジマップビューの詳細と作成方法についてはこちらをご参照ください。 |
可用性と正常性ウィジェット
| ウィジェット名 | 説明 |
|---|---|
| インフラストラクチャスナップショット | 可用性と正常性を、監視タイプ毎にグループ化して表示 |
| 可用性/正常性のスナップショット | 指定したタイプの監視の状態を表示 |
| 最新24時間/30日間の可用性履歴 | 選択した監視タイプに当てはまるすべての監視の、最新24時間か30日間の可用性の履歴を表示 |
| 最新24時間/30日間の正常性履歴 | 選択した監視タイプに当てはまるすべての監視の、最新24時間か30日間の正常性の履歴を表示 |
| 可用性/正常性/アラートのサマリ | 選択した監視カテゴリの可用性と正常性、およびアラートの状態を表示 |
| ヒートマップウィジェット | 選択した監視のステータスと可用性の状態を色で表示 選択したすべての監視の概要チャートを表示することも可能です。監視の状態と影響範囲を円グラフで把握できます。 |
| 監視ステータス概要 | 選択した監視の可用性と正常性を、各ステータスで色別で表示 円グラフで全体の監視数と可用性を表示します。 |
| ADDM依存関係マップ | 選択した依存関係マップの、相互に接続されているサーバーとその関連アプリケーションを可視化 |
| ダウンタイムスケジュールで非管理の監視ウィジェット | ダウンタイムスケジュールが割り当てられている監視の一覧を表示し、その監視が現在スケジュールメンテナンス中であるか、非管理状態であるかを表示 |
| サーバーアップタイムウィジェット | サーバーのアップタイムを表示 |
アラート
| ウィジェット名 | 説明 |
|---|---|
| 最新アラート | すべての監視の最新アラートを表示 |
| ステータスとダウンタイムごとの監視ウィジェット | 一定期間ダウンしているすべての監視のステータスと可用性のステータスを表示 |
| アラートサマリウィジェット | すべての監視と監視グループのアラートを表示 |
| 監視エラーステータス | 選択した監視のデータ収集にかかった時間とステータスを、成功/エラーメッセージと最終ポーリング時間と共に表示 また、選択したすべての監視の概要チャートを表示し、監視のデータ収集状況を可視化することが可能です。 |
Alarms
- Alarm Summary Widget: This widget displays alerts for all monitors and monitor groups.
- Application Health Summary:The Application Health Summary Widget provides a
comprehensive view of event data across various monitor groups and categories. The Sunburst
chart offers a high-level overview of events categorized by severity and monitor type, while
the drill-down feature enables users to click on specific monitor types to view detailed
information about each monitor’s events.
Widget Views:
- L0 - Chart View: Displays a Sunburst chart that visually
represents the distribution of events based on severity and monitor type,
organized by category. This hierarchical breakdown makes it easier to assess
overall system health at a glance.
![Applications Manager Dashboards and Widgets: L0 - Chart View]()
- L1 - Drill Down View: Allows users to click on any monitor type
segment in the Sunburst chart to access detailed information about the specific
monitor’s events for deeper investigation.
![Applications Manager Dashboards and Widgets: L1 - Chart View]()
- APM Insight - Transactions Drill Down
![Applications Manager Dashboards and Widgets: Transactions Drill Down]()
- APM Insight - 4xx/5xx Errors Drill Down
![Applications Manager Dashboards and Widgets: Errors Drill Down]()
- Monitor Group: Single select option for choosing a specific monitor group.
- Severity: Clear, Critical, Warning.
- Category: APM Insight - 4xx Errors, APM Insight - 5xx Errors, APM Insight - Transactions, APM Insight Instance, Custom Queries, Database Servers, Servers.
- Time Filter: Choose the desired time range, from the last 5 minutes to a custom period.
- Transaction Category: By default, 'All Transactions' is selected. If 'Key Transactions' is selected, only transactions marked as key are shown.
- Response Time: Apply a response time threshold to display only transactions that meet the specified criteria (supports up to two decimal places).
- Error %: Filter and display only transactions that match the specified error percentage criteria.
- L0 - Chart View: Displays a Sunburst chart that visually
represents the distribution of events based on severity and monitor type,
organized by category. This hierarchical breakdown makes it easier to assess
overall system health at a glance.
- Attributes Alarm Widget: This widget displays the severity of Health, Availability, and Attributes, along with the threshold configuration of all MOs based on the widget configuration. It contains information about the Status, Alert message, Attribute name, Monitor name, Modified time, and Duration, along with some actions.
- Last N Alarms: This widget displays the last N alarms for all the monitors.
- Monitor Errors Status Widget: This widget displays the status and time duration taken to perform data collection of selected monitors, along with its Success/Error message and Last polled time. Also, you have the option to display the summary chart of all the selected monitors which allows you to quickly grasp the data collection status of monitors in the form of a pie chart.
- Monitors by Status and Downtime Widget: This widget shows the health and availability status of all monitors that are down for a certain time duration.


監視グループウィジェット
| ウィジェット名 | 説明 |
|---|---|
| 可用性と正常性 | すべての監視グループの可用性とステータスの状態、および過去24時間の可用性を表示 |
| 最新24時間/30日間の可用性履歴 | すべての監視グループの、最新24時間か30日間の可用性の履歴を表示 |
| 最新24時間/30日間の正常性履歴 | すべての監視グループの、最新24時間か30日間の正常性の履歴を表示 |
| ビジネスビューウィジェット | 監視グループのビジネスビューを表示 |
| 監視グループツリービュー | 監視グループ内の監視一覧とその正常性と可用性を、ツリー構造で表示 |
| ワールドマップビュー | 監視グループにロケーションが割り当てられている場合、マップビューで監視グループとサブグループを表示 |
ユーティリティウィジェット
| ウィジェット名 | 説明 |
|---|---|
| Webページ埋め込み | 他のアプリケーションのWebページをダッシュボードで表示 このウィジェットを使用して、複数のカスタムダッシュボードを統合することも可能です。 |
| ブックマーク | 任意のURLへのウェブリンクを表示 |
| カスタムHTML/テキスト | ダッシュボード上にメモを追加 |
ウィジェットとダッシュボードのアクション
ダッシュボードの編集や管理の操作を行うには、[アクション]タブをクリックします。
| アクション | 説明 |
|---|---|
| ウィジェット追加 | 新しいウィジェットを追加 |
| ダッシュボードの編集 | ダッシュボードの名前や列数などを編集 |
| ダッシュボード削除 | 選択したダッシュボードを削除 ※デフォルトダッシュボードにはこのオプションは表示されません。 |
| 新規ダッシュボード | 新しいダッシュボードを作成 |
| ダッシュボードの公開 | 選択したダッシュボードの公開用コードスニペットを表示 指定されたJavascriptコードスニペットを使用して、外部のWebポータル等にApplications Managerの監視データを統合できます。 |
| デフォルトに設定 | 選択したダッシュボードをデフォルトに設定 ホームタブにアクセスすると、デフォルトに設定したダッシュボードが最初に表示されます。 |
- The Publish Dashboard option, Dashboard Report option, and Widget-level actions are not supported for the Application dashboard.
- We do not support the publishing of dashboards while SSO is enabled.
- The ADDM Dependency Map widget is not available for Delegated Admin and Operator Role users.
- The Topology Map View widget in published dashboards is only supported from build 170200.
- If you install a Non-English Version, say the Chinese version, of Applications Manager, and then change your language settings to English, the Widget and Dashboard names will not automatically be translated from Chinese to English characters. You can, however, manually edit the Dashboard or Widget and change the name to English characters.
Dashboard Level Time Period: Choose to either apply a time period from the dropdown to all widgets in the dashboard or let each widget use its own unique time period.
- Performance Metric Widgets
- Professional Edition: Time periods such as Last 30 Minutes, Last 1 Hour, Last 3 Hours, Last 6 Hours, and Last 12 Hours are not supported. Selecting these at the dashboard level will show last polled data for metric values, while line graphs will display data for the chosen time period.
- Enterprise Edition: These same time periods are also not supported. Selecting them at the dashboard level will show Last 24 Hours data for metrics, while line graphs will display data for the chosen time period.
- Monitor or Monitor Group Health Widgets (Last 24 Hours / 30 Days Health History, Monitor Groups – Health History): "Last 30 Minutes" is not supported and will default to "Last 1 Hour".
- Other widgets will load data for the selected time periods with no limitations.
Edit Tabs - Assign Dashboards to Tabs: Choose the order in which the dashboard will be listed under the Home tab.
Repositioning Widgets
In Dashboards, you are provided with an option to reposition and resize any widgets of your choice. Follow the given steps for the same:
- Go to Dashboard. Choose the widgets you want to reposition or resize.
- Drag and drop to change the position of the widgets.
- Click Save button.
- If the changes implemented in the layout are no more necessary, click on Reset or Cancel button to restore the widgets in the existing layout.
- Zoom in for better data exploration.
- Scrollable Legends for convenient navigation, even with multiple monitors.
- Set a custom time frame in the Overview Chart.

- Widget resizing can be performed only in horizontal directions.
- Default Widget Positioning: The widget spans across 2 columns on the screen and its position is determined by the order in which the widgets were created.
トポロジマップビュー
トポロジマップは、組織内のリソースの相互関係を可視化します。
特定のネットワーク機器やサーバーをマップ上でグループ化し、それぞれのつながり方を描画できます。
また、マップの中にサブマップビューを作成し、サブマップから親マップへのショートカットアイコンを表示できます。
背景画像にはデフォルトのもののほか、独自ファイルのインポートも可能です。
- [ホーム]タブで[アクション]→ [新規ダッシュボード]をクリックし、[新規ダッシュボードの作成]ページに遷移
- ダッシュボードの名前と説明を入力
- カラム数を選択して、ダッシュボードのレイアウト情報を設定
- 任意で、[この監視グループをテンプレートダッシュボードにする]を選択
テンプレート化することで、特定の監視グループに適用したり、すべての監視グループに適用することも可能です。 - ウィジェット一覧から監視グループウィジェット配下のトポロジマップビューを選択
- 作成をクリック
空のトポロジマップビューウィジェットを含む新しいダッシュボードが作成されます。- トポロジマップを追加/関連付ける
[ウィジェットの編集](鉛筆アイコン)をクリック
ウィジェットの名前と説明を入力
ドロップダウンメニューから既存のトポロジマップを選択するか、[追加]をクリックして新規トポロジマップを追加
- トポロジマップを追加/関連付ける
- 設定の保存をクリック
作成したトポロジマップがウィジェットに表示されます。
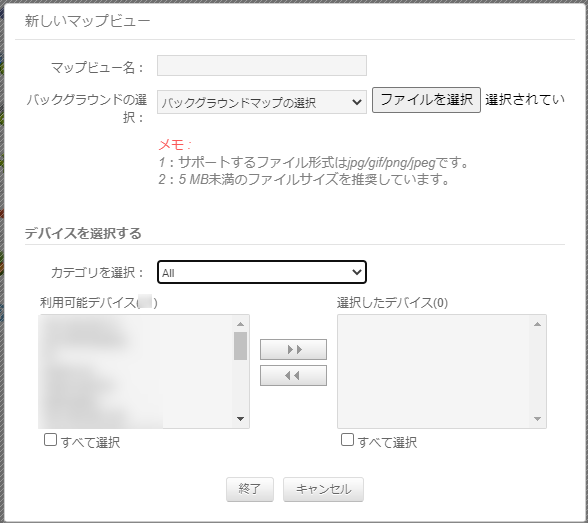
- 新しいマップビューウィンドウで、マップビュー名を入力
- バックグラウンドの選択のドロップダウンダウンリストから背景を選択するか、[ファイルを選択]をクリックして、任意のマップ・画像をインポート
- ドロップダウンリストからデバイスのカテゴリーを選択
- Applications Manager上に登録されているデバイスの一覧から、マップ上に表示させたいデバイスを選択
デバイスを選択し、>>ボタンをクリックすると、マップに追加されます
「Ctrl」ボタンを押しながらデバイスを複数選択したり、[すべて選択]チェックボックスを使用して一括ですべてのデバイスを選択できます。![新規トポロジマップを追加]()
- [終了]をクリック
選択したデバイスと背景画像を含むマップビューが作成されます。
マップビューは編集モードで表示されます。編集モードでは、以下の操作が可能です。- マップにデバイスやサーバーを追加
- 2つのデバイス間のリンクを追加
- マップから他のマップへのショートカットを追加
- マップを削除
- マップのプロパティ (背景のマップ画像など) を変更
- 必要な操作を実行後、[保存]ボタンをクリックし、マップを保存
Business View
Business View helps to provide a holistic view of the resources that are monitored in a business infrastructure by displaying a hierarchical tree view of the monitors that are added to the Monitor Groups. Business View can be accessed either by adding as a widget or by clicking the Business View tab from the Applications Manager dashboard.
To create a customizable business view, follow the steps given below:
- In the Business View widget, select Add New View under View Settings. A new popup window will be opened to create a new view.
- Specify the Display Name of the Business View under View Properties tab.
- Then select the Monitor Groups that are to be added for this view under Associated Monitor Groups tab.
- Click on Save Configuration button to add the view.
The business view will be created and can be viewed by selecting the newly-added business view from the Select View dropdown.
You can edit, delete, or reset the required business view whenever required by selecting the appropriate option under View Settings. Additionally, you can publish the business view for external users and also embed them into an HTML web page by copy-pasting the generated code snippet under View Settings → Publish View. You can also set a specific business view as the default view by choosing Set as Default under View Settings.
Customizing the Business View
You can also customize your business view accordingly based on your requirements by selecting the required business view from the dropdown and then clicking on Display Properties under View Settings. Following are the list of options that can be configured in the Display Properties window:
- Show Label for Monitors: Shows the display name of the monitors present in the Monitor Group. By default, this option is enabled.
- Show only Monitor Groups and Sub Groups: Shows only the Monitor Groups and Sub-Groups that are added to the view and hides the monitors present under them.
- Show Only Top Level Sub Groups: Shows only the first-level Sub Groups that are added to the Monitor Group and hides the monitors and the remaining Sub Groups under it.
- Show only critical monitors: Shows only the monitors that are of Critical severity for the Monitor Group.
- Show only Monitor Groups Status: Shows only the status of the Monitor Groups that are added to this view.
In addition to the above options, you can also customize the style of the Business View based on background color, line color, label color, line thickness, line transparency, and node/font zoom ratio. You can also select the orientation of the business view in terms of Left-Right or Top-Bottom view.
NOC View
NOC View acts as a monitoring interface or display setup used in network operations centers to oversee and manage IT networks and infrastructure. Applications Manager's NOC View feature offers an effective and uninterrupted monitoring tool to keep track of critical network performance metrics and dashboards for Network Operations Centers. Learn more about NOC views.
To create a NOC view, follow the steps given below:
- You can view, edit, or delete the required business view whenever required by selecting the appropriate option under Dashboards → Actions → NOC Views.
- Click Create New option.
- Specify the Name and Refresh Interval.
- Choose the Theme as Dark or Light per your choice.
- Select the desired dashboards from the Dashboards list, that you want to include in the NOC view.
- Click Create.
You can edit or delete the required business view whenever required by selecting the appropriate option under Dashboards → Actions → NOC Views.